Matematisk Model for Mavesækkens Tømning - Danmarks Tekniske ...
Matematisk Model for Mavesækkens Tømning - Danmarks Tekniske ...
Matematisk Model for Mavesækkens Tømning - Danmarks Tekniske ...

You also want an ePaper? Increase the reach of your titles
YUMPU automatically turns print PDFs into web optimized ePapers that Google loves.
22 if Data(i,j) ≥ cs<br />
23 if Data(i,j−2) < cs && Data(i,j−1) < cs && ...<br />
24 Data(i,j+1) ≥ cs && Data(i,j+2) ≥ cs<br />
25 % 5 conditions have to be meet be<strong>for</strong>e defining a border.<br />
26 Borderline(i,j) = 1;<br />
27 elseif Data(i,j−2) ≥ cs && Data(i,j−1) ≥ cs && ...<br />
28 Data(i,j+1) < cs && Data(i,j+2) < cs<br />
29 % 5 conditions have to be meet be<strong>for</strong>e defining a border.<br />
30 Borderline(i,j) = 1;<br />
31 end<br />
32 end<br />
33 end<br />
34 end<br />
35<br />
36 % Assignning all the values between the borders to the value of 1.<br />
37 <strong>for</strong> k = 1:1:si<br />
38 [i,j] = find(Borderline(k,:));<br />
39 if length(j) ≥ 2<br />
40 Borderline(k,j(1):j(end)) = 1;<br />
41 end<br />
42 end<br />
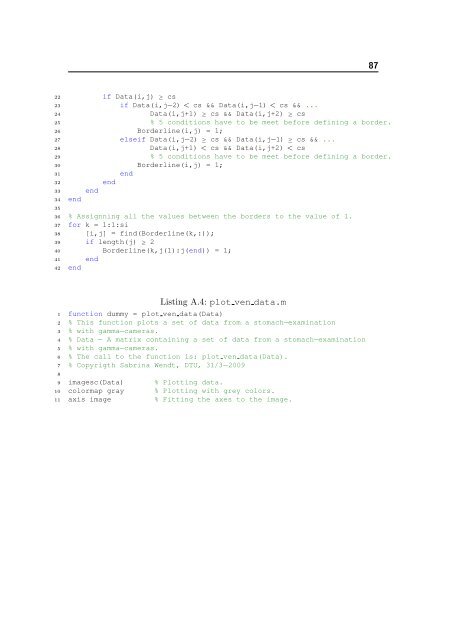
Listing A.4: plot ven data.m<br />
1 function dummy = plot ven data(Data)<br />
2 % This function plots a set of data from a stomach−examination<br />
3 % with gamma−cameras.<br />
4 % Data − A matrix containing a set of data from a stomach−examination<br />
5 % with gamma−cameras.<br />
6 % The call to the function is: plot ven data(Data).<br />
7 % Copyrigth Sabrina Wendt, DTU, 31/3−2009<br />
8<br />
9 imagesc(Data) % Plotting data.<br />
10 colormap gray % Plotting with grey colors.<br />
11 axis image % Fitting the axes to the image.<br />
87