India Architectural Lighting Market: Opportunities and Forecast (2017 – 2022)
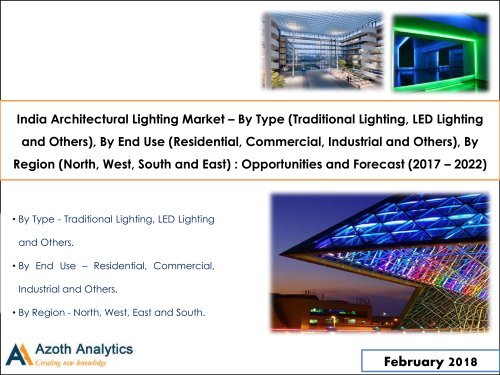
According to Azoth Analytics research report, “India Architectural Lighting Market – By Type (Traditional Lighting, LED Lighting and Others), By End Use (Residential, Commercial, Industrial and Others), By Region (North, West, South and East) : Opportunities and Forecast (2017 – 2022)”, regional market is projected to display a vigorous growth represented by a CAGR of 5.78% during 2017 – 2022, chiefly driven by increase in disposable income in the country as well as rapidly growing urbanization.
According to Azoth Analytics research report, “India Architectural Lighting Market – By Type (Traditional Lighting, LED Lighting and Others), By End Use (Residential, Commercial, Industrial and Others), By Region (North, West, South and East) : Opportunities and Forecast (2017 – 2022)”, regional market is projected to display a vigorous growth represented by a CAGR of 5.78% during 2017 – 2022, chiefly driven by increase in disposable income in the country as well as rapidly growing urbanization.
Create successful ePaper yourself
Turn your PDF publications into a flip-book with our unique Google optimized e-Paper software.
<strong>India</strong> <strong>Architectural</strong> <strong>Lighting</strong> <strong>Market</strong> <strong>–</strong> By Type (Traditional <strong>Lighting</strong>, LED <strong>Lighting</strong><br />
<strong>and</strong> Others), By End Use (Residential, Commercial, Industrial <strong>and</strong> Others), By<br />
Region (North, West, South <strong>and</strong> East) : <strong>Opportunities</strong> <strong>and</strong> <strong>Forecast</strong> (<strong>2017</strong> <strong>–</strong> <strong>2022</strong>)<br />
• By Type - Traditional <strong>Lighting</strong>, LED <strong>Lighting</strong><br />
<strong>and</strong> Others.<br />
• By End Use <strong>–</strong> Residential, Commercial,<br />
Industrial <strong>and</strong> Others.<br />
• By Region - North, West, East <strong>and</strong> South.<br />
February 2018
<strong>India</strong> <strong>Architectural</strong> <strong>Lighting</strong> <strong>Market</strong> <strong>–</strong> By Type (Traditional <strong>Lighting</strong>, LED <strong>Lighting</strong> <strong>and</strong> Others), By End Use (Residential,<br />
Commercial, Industrial <strong>and</strong> Others), By Region (North, West, South <strong>and</strong> East) : <strong>Opportunities</strong> <strong>and</strong> <strong>Forecast</strong> (<strong>2017</strong> <strong>–</strong> <strong>2022</strong>)<br />
Scope of the Study<br />
g<br />
Country Coverage<br />
Regional Coverage<br />
Segment Coverage<br />
By Type<br />
By End Use<br />
<br />
<br />
Country (<strong>India</strong>)<br />
Region (North, West, East, South)<br />
Country Coverage<br />
<strong>India</strong> <strong>Architectural</strong> <strong>Lighting</strong> <strong>Market</strong> <strong>–</strong> By Value<br />
(2012-2016)<br />
<strong>India</strong> <strong>Architectural</strong> <strong>Lighting</strong> <strong>Market</strong> <strong>–</strong> By Value<br />
(<strong>2017</strong>-<strong>2022</strong>)<br />
Breakdown-By Type<br />
• Traditional <strong>Lighting</strong><br />
• LED <strong>Lighting</strong><br />
• Others<br />
Breakdown-By End Use<br />
• Residential<br />
• Commercial<br />
• Industrial<br />
• Others<br />
Regional Coverage<br />
North<br />
East<br />
West<br />
South<br />
<strong>Architectural</strong> <strong>Lighting</strong> <strong>Market</strong><br />
(2012-<strong>2022</strong>)<br />
• By Value<br />
• By Type, By Value<br />
• By End Use, By Value<br />
Company Coverage<br />
Philips <strong>Lighting</strong> <strong>India</strong><br />
Limited.<br />
Bajaj Electricals<br />
Crompton<br />
Osram <strong>India</strong> Limited<br />
Wipro <strong>Lighting</strong><br />
Havells <strong>India</strong> Limited.<br />
Sales*<br />
Business Overview<br />
Product Benchmarking<br />
Production Analysis<br />
*for listed companies only.<br />
2
Table of Content<br />
S.No Particulars Page No.<br />
1. Research Methodology 13<br />
2. Executive Summary 14<br />
3. Strategic Recommendation 15<br />
3.1 Growing dem<strong>and</strong> from residential sector. 16<br />
3.2 LED architectural lighting products to witness consistent growth. 17<br />
4. <strong>India</strong> <strong>Architectural</strong> <strong>Lighting</strong> <strong>Market</strong>: Product Outlook 18<br />
5. <strong>India</strong> <strong>Architectural</strong> <strong>Lighting</strong> <strong>Market</strong>: Growth <strong>and</strong> <strong>Forecast</strong> 20<br />
5.1 By Value (2012-2016) 21<br />
5.2 By Value (<strong>2017</strong>-<strong>2022</strong>) 22<br />
6. <strong>India</strong> <strong>Architectural</strong> <strong>Lighting</strong> <strong>Market</strong> <strong>–</strong> Segmental Analysis 27<br />
3
Table of Content<br />
S.No Particulars Page No.<br />
6.1 <strong>India</strong> <strong>Architectural</strong> <strong>Lighting</strong> <strong>Market</strong> Size, By Type : Breakdown (%) 29<br />
6.1.1 <strong>India</strong> <strong>Architectural</strong> <strong>Lighting</strong> <strong>Market</strong> Size, By Type, 2016 (%) 29<br />
6.1.2 <strong>India</strong> <strong>Architectural</strong> <strong>Lighting</strong> <strong>Market</strong> Size, By Type, <strong>2022</strong> (%) 30<br />
6.2 <strong>India</strong> Traditional <strong>Architectural</strong> <strong>Lighting</strong> <strong>Market</strong>: Growth <strong>and</strong> <strong>Forecast</strong> 31<br />
6.2.1 By Value (2012-2016) 31<br />
6.2.2 By Value (<strong>2017</strong>-<strong>2022</strong>) 31<br />
6.3 <strong>India</strong> LED <strong>Lighting</strong> <strong>Market</strong>: Growth <strong>and</strong> <strong>Forecast</strong> 32<br />
6.3.1 By Value (2012-2016) 32<br />
6.3.2 By Value (<strong>2017</strong>-<strong>2022</strong>) 32<br />
6.4 Other <strong>Architectural</strong> <strong>Lighting</strong> <strong>Market</strong>: Growth <strong>and</strong> <strong>Forecast</strong> 33<br />
6.4.1 By Value (2012-2016) 33<br />
6.4.2 By Value (<strong>2017</strong>-<strong>2022</strong>) 33<br />
6.5 <strong>India</strong> <strong>Architectural</strong> <strong>Lighting</strong> <strong>Market</strong> Size, By End Use : Breakdown (%) 34<br />
4
Table of Content<br />
S.No Particulars Page No.<br />
6.5.1 <strong>India</strong> <strong>Architectural</strong> <strong>Lighting</strong> <strong>Market</strong> Size, By End Use, 2016 (%) 35<br />
6.5.2 <strong>India</strong> <strong>Architectural</strong> <strong>Lighting</strong> <strong>Market</strong> Size, By End Use, <strong>2022</strong> (%) 36<br />
6.6 <strong>India</strong> Residential <strong>Architectural</strong> <strong>Lighting</strong> <strong>Market</strong>: Growth <strong>and</strong> <strong>Forecast</strong> 37<br />
6.6.1 By Value (2012-2016) 37<br />
6.6.2 By Value (<strong>2017</strong>-<strong>2022</strong>) 37<br />
6.7 <strong>India</strong> Commercial <strong>Architectural</strong> <strong>Lighting</strong> <strong>Market</strong>: Growth <strong>and</strong> <strong>Forecast</strong> 38<br />
6.7.1 By Value (2012-2016) 38<br />
6.7.2 By Value (<strong>2017</strong>-<strong>2022</strong>) 38<br />
6.8 <strong>India</strong> Industrial <strong>Lighting</strong> <strong>Market</strong>: Growth <strong>and</strong> <strong>Forecast</strong> 39<br />
6.8.1 By Value (2012-2016) 39<br />
6.8.2 By Value (<strong>2017</strong>-<strong>2022</strong>) 39<br />
6.9 Other <strong>Architectural</strong> <strong>Lighting</strong> <strong>Market</strong>: Growth <strong>and</strong> <strong>Forecast</strong> 40<br />
6.9.1 By Value (2012-2016) 40<br />
5
Table of Content<br />
S.No Particulars Page No.<br />
6.9.2 By Value (<strong>2017</strong>-<strong>2022</strong>) 40<br />
7. <strong>India</strong> <strong>Architectural</strong> <strong>Lighting</strong> <strong>Market</strong> : Regional Analysis 41<br />
7.1 <strong>India</strong> <strong>Architectural</strong> <strong>Lighting</strong> <strong>Market</strong> Size, By Region : Breakdown (%) 41<br />
7.1.1 <strong>India</strong> <strong>Architectural</strong> <strong>Lighting</strong> <strong>Market</strong> Size, By Region, 2016 (%) 42<br />
7.1.2 <strong>India</strong> <strong>Architectural</strong> <strong>Lighting</strong> <strong>Market</strong> Size, By Region, <strong>2022</strong> (%) 43<br />
7.2 North <strong>India</strong> <strong>Architectural</strong> <strong>Lighting</strong> <strong>Market</strong> : Growth <strong>and</strong> <strong>Forecast</strong> 44<br />
7.2.1 By Value (2012-<strong>2022</strong>) 45<br />
7.2.2 By Type, By Value (2012-<strong>2022</strong>) 48<br />
7.2.3 By End Use, By Value (2012-<strong>2022</strong>) 49<br />
7.3 East <strong>India</strong> <strong>Architectural</strong> <strong>Lighting</strong> <strong>Market</strong> : Growth <strong>and</strong> <strong>Forecast</strong> 50<br />
7.3.1 By Value (2012-<strong>2022</strong>) 51<br />
7.3.2 By Type, By Value (2012-<strong>2022</strong>) 54<br />
7.3.3 By End Use, By Value (2012-<strong>2022</strong>) 55<br />
6
Table of Content<br />
S.No Particulars Page No.<br />
7.4 West <strong>India</strong> <strong>Architectural</strong> <strong>Lighting</strong> <strong>Market</strong> : Growth <strong>and</strong> <strong>Forecast</strong> 56<br />
7.4.1 By Value (2012-<strong>2022</strong>) 57<br />
7.4.2 By Type, By Value (2012-<strong>2022</strong>) 60<br />
7.4.3 By End Use, By Value (2012-<strong>2022</strong>) 61<br />
7.5 South <strong>India</strong> <strong>Architectural</strong> <strong>Lighting</strong> <strong>Market</strong> : Growth <strong>and</strong> <strong>Forecast</strong> 62<br />
7.5.1 By Value (2012-<strong>2022</strong>) 63<br />
7.5.2 By Type, By Value (2012-<strong>2022</strong>) 66<br />
7.5.3 By End Use, By Value (2012-<strong>2022</strong>) 67<br />
8. <strong>India</strong> <strong>Architectural</strong> <strong>Lighting</strong> <strong>Market</strong> Dynamics 68<br />
8.1 <strong>India</strong> <strong>Architectural</strong> <strong>Lighting</strong> <strong>Market</strong> Drivers 69<br />
8.2 <strong>India</strong> <strong>Architectural</strong> <strong>Lighting</strong> <strong>Market</strong> Restraints 74<br />
9. <strong>India</strong> <strong>Architectural</strong> <strong>Lighting</strong> <strong>Market</strong> Trend 77<br />
10. <strong>India</strong> <strong>Architectural</strong> <strong>Lighting</strong> <strong>Market</strong> : Production Analysis 78<br />
7
Table of Content<br />
S.No Particulars Page No.<br />
11. Competitive L<strong>and</strong>scape 81<br />
11.1 Company Share Analysis 82<br />
12. Company Profiling 84<br />
12.1 Philips <strong>Lighting</strong> <strong>India</strong> Limited 85<br />
12.2 Bajaj Electricals 87<br />
12.3 Crompton 89<br />
12.4 Osram <strong>India</strong> Limited 91<br />
12.5 Wipro <strong>Lighting</strong> 92<br />
12.6 Havells <strong>India</strong> Limited 93<br />
13. About Us 95<br />
8
List of Figures<br />
Figure No. Figure Title Page No.<br />
Figure 1: <strong>India</strong> <strong>Architectural</strong> <strong>Lighting</strong> <strong>Market</strong> Size, By Value, 2012-2016 (USD Million) 22<br />
Figure 2: <strong>India</strong> <strong>Architectural</strong> <strong>Lighting</strong> <strong>Market</strong> Size, By Value, <strong>Forecast</strong>, <strong>2017</strong>-<strong>2022</strong>(USD Million) 23<br />
Figure 3: <strong>India</strong>, Degree of Urbanization, 2012-2016 (%) 25<br />
Figure 4: <strong>India</strong>, Infrastructure Investment in Construction Sector, 2012-<strong>2017</strong>, (USD Billion) 25<br />
Figure 5: <strong>India</strong> GDP (USD Trillion, 2012-2016) 26<br />
Figure 6: <strong>India</strong>, Real GDP Growth Rate, 2012-<strong>2022</strong>F, (%) 26<br />
Figure 7: <strong>India</strong> <strong>Architectural</strong> <strong>Lighting</strong> <strong>Market</strong> Size, By Type, 2016 (%) 29<br />
Figure 8: <strong>India</strong> <strong>Architectural</strong> <strong>Lighting</strong> <strong>Market</strong> Size, By Type, <strong>2022</strong> (%) 30<br />
Figure 9: <strong>India</strong> Traditional <strong>Architectural</strong> <strong>Lighting</strong> <strong>Market</strong>, By Value, 2012-2016 (USD Million) 31<br />
Figure 10: <strong>India</strong> Traditional <strong>Architectural</strong> <strong>Lighting</strong> <strong>Market</strong>, By Value, <strong>Forecast</strong>, <strong>2017</strong>-<strong>2022</strong>(USD Million) 31<br />
Figure 11: <strong>India</strong> LED <strong>Lighting</strong> <strong>Market</strong>, By Value, 2012-2016 (USD Million) 32<br />
Figure 12: <strong>India</strong> LED <strong>Lighting</strong> <strong>Market</strong>, By Value, <strong>Forecast</strong>, <strong>2017</strong>-<strong>2022</strong> (USD Million) 32<br />
Figure 13: Other <strong>Architectural</strong> <strong>Lighting</strong> <strong>Market</strong>, By Value, 2012-2016 (USD Million) 33<br />
Figure 14: Other <strong>Architectural</strong> <strong>Lighting</strong> <strong>Market</strong>, By Value, <strong>Forecast</strong>, <strong>2017</strong>-<strong>2022</strong>(USD Million) 33<br />
Figure 15: <strong>India</strong> <strong>Architectural</strong> <strong>Lighting</strong> <strong>Market</strong> Size, By End Use, 2016 (%) 35<br />
Figure 16: <strong>India</strong> <strong>Architectural</strong> <strong>Lighting</strong> <strong>Market</strong> Size, By End Use, <strong>2022</strong> (%) 36<br />
Figure 17: <strong>India</strong> Residential <strong>Architectural</strong> <strong>Lighting</strong> <strong>Market</strong>, By Value, 2012-2016 (USD Million) 37<br />
Figure 18: <strong>India</strong> Residential <strong>Architectural</strong> <strong>Lighting</strong> <strong>Market</strong>, By Value, <strong>Forecast</strong>, <strong>2017</strong>-<strong>2022</strong> (USD Million) 37<br />
Figure 19: <strong>India</strong> Commercial <strong>Architectural</strong> <strong>Lighting</strong> <strong>Market</strong>, By Value, 2012-2016 (USD Million) 38<br />
9
List of Figures<br />
Figure No. Figure Title Page No.<br />
Figure 20: <strong>India</strong> Commercial <strong>Architectural</strong> <strong>Lighting</strong> <strong>Market</strong>, By Value, <strong>Forecast</strong>, <strong>2017</strong>-<strong>2022</strong> (USD Million) 38<br />
Figure 21: <strong>India</strong> Industrial <strong>Lighting</strong> <strong>Market</strong>, By Value, 2012-2016 (USD Million) 39<br />
Figure 22: <strong>India</strong> Industrial <strong>Lighting</strong> <strong>Market</strong>, By Value, <strong>Forecast</strong>, <strong>2017</strong>-<strong>2022</strong> (USD Million) 39<br />
Figure 23: Other <strong>Architectural</strong> <strong>Lighting</strong> <strong>Market</strong>, By Value, 2012-2016 (USD Million) 40<br />
Figure 24: Other <strong>Architectural</strong> <strong>Lighting</strong> <strong>Market</strong>, By Value, <strong>Forecast</strong>, <strong>2017</strong>-<strong>2022</strong> (USD Million) 40<br />
Figure 25: <strong>India</strong> <strong>Architectural</strong> <strong>Lighting</strong> <strong>Market</strong> Size, By Region, 2016 (%) 42<br />
Figure 26: <strong>India</strong> <strong>Architectural</strong> <strong>Lighting</strong> <strong>Market</strong> Size, By Region, <strong>2022</strong> (%) 43<br />
Figure 27: North <strong>India</strong> <strong>Architectural</strong> <strong>Lighting</strong> <strong>Market</strong> Size, By Value, 2012-<strong>2022</strong> (USD Million) 45<br />
Figure 28: North <strong>India</strong> Proportion of Urban Population, By States/Cities (% of total) 46<br />
Figure 29: North <strong>India</strong> Tourist Arrivals, By Leading States/Cities, 2014,2015 (000)+ 46<br />
Figure 30: <strong>India</strong> North Region NSDP At Current Prices, By State, (INR Crore) 47<br />
Figure 31: North <strong>India</strong> <strong>Architectural</strong> <strong>Lighting</strong> <strong>Market</strong>, By Type, By Value, 2012-<strong>2022</strong> (USD Million) 48<br />
Figure 32: North <strong>India</strong> <strong>Architectural</strong> <strong>Lighting</strong> <strong>Market</strong>: By End Use, By Value, 2012-<strong>2022</strong>, (USD Million) 49<br />
Figure 33: East <strong>India</strong> <strong>Architectural</strong> <strong>Lighting</strong> <strong>Market</strong> Size, By Value, 2012-<strong>2022</strong> (USD Million) 51<br />
Figure 34: East <strong>India</strong> Proportion of Urban Population, By States/Cities (% of total) 52<br />
Figure 35: East <strong>India</strong> Tourist Arrivals, By Leading States/Cities, 2014, 2015 52<br />
Figure 36: <strong>India</strong> East Region NSDP At Current Prices, By State, (INR Crore) 53<br />
Figure 37: East <strong>India</strong> <strong>Architectural</strong> <strong>Lighting</strong> <strong>Market</strong>, By Type, By Value, 2012-<strong>2022</strong> (USD Million) 54<br />
Figure 38: East <strong>India</strong> <strong>Architectural</strong> <strong>Lighting</strong> <strong>Market</strong>: By End Use, By Value, 2012-<strong>2022</strong>, (USD Million) 55<br />
Figure 39: West <strong>India</strong> <strong>Architectural</strong> <strong>Lighting</strong> <strong>Market</strong> Size, By Value, 2012-<strong>2022</strong> (USD Million) 57<br />
10
List of Figures<br />
Figure No. Figure Title Page No.<br />
Figure 40: West <strong>India</strong> Proportion of Urban Population, By States/Cities (% of total) 58<br />
Figure 41: West <strong>India</strong> Tourist Arrivals, By Leading States/Cities, 2014,2015 58<br />
Figure 42: West <strong>India</strong> Region NSDP At Current Prices, By Select State, (INR Crore) 59<br />
Figure 43: West <strong>India</strong> <strong>Architectural</strong> <strong>Lighting</strong> <strong>Market</strong>, By Type, By Value, 2012-<strong>2022</strong> (USD Million) 60<br />
Figure 44: West <strong>India</strong> <strong>Architectural</strong> <strong>Lighting</strong> <strong>Market</strong>: By End Use, By Value, 2012-<strong>2022</strong>, (USD Million) 61<br />
Figure 45: South <strong>India</strong> <strong>Architectural</strong> <strong>Lighting</strong> <strong>Market</strong> Size, By Value, 2012-<strong>2022</strong> (USD Million) 63<br />
Figure 46: South <strong>India</strong> Proportion of Urban Population, By States/Cities (% of total) 64<br />
Figure 47: South <strong>India</strong> Tourist Arrivals, By Leading States/Cities, 2014,2015 (in thous<strong>and</strong>s) 64<br />
Figure 48: South <strong>India</strong> Region NSDP At Current Prices, By Select State, (INR Crore) 65<br />
Figure 49: South <strong>India</strong> <strong>Architectural</strong> <strong>Lighting</strong> <strong>Market</strong>, By Type, By Value, 2012-<strong>2022</strong> (USD Million) 66<br />
Figure 50: South <strong>India</strong> <strong>Architectural</strong> <strong>Lighting</strong> <strong>Market</strong>: By End Use, By Value, 2012-<strong>2022</strong>, (USD Million) 67<br />
Figure 51: Production of Inc<strong>and</strong>escent Lamps in <strong>India</strong>, 2012-2016 (In Million Pieces Per Year) 79<br />
Figure 52: Production of Fluorescent Lamps in <strong>India</strong>, 2012-2016 (In Million Pieces Per Year) 79<br />
Figure 53: Production of Compact Fluorescent Lamps in <strong>India</strong>, 2012-2016 (In Million Pieces Per Year) 80<br />
Figure 54: Production of LED Retrofit Lamps in <strong>India</strong>, 2014-2016 (In Million Pieces Per Year) 80<br />
Figure 55: Production of LED Street Lights in <strong>India</strong>, 2014-2016 (In Million Pieces Per Year) 80<br />
Figure 56: <strong>India</strong> <strong>Architectural</strong> <strong>Lighting</strong> <strong>Market</strong>, By Company Share, 2016 (%) 82<br />
Figure 57: Philips <strong>Lighting</strong> <strong>India</strong> Ltd., Revenue, 2015-<strong>2017</strong> (INR Million) 86<br />
Figure 58: Philips <strong>Lighting</strong> N.V., Revenue, By Business Segments, 2016 (%) 86<br />
Figure 59: Philips <strong>Lighting</strong> N.V., By Geography, 2016 (%) 86<br />
Figure 60: Bajaj Electricals, Revenue, 2012-<strong>2017</strong> (INR Cr) 88<br />
11
List of Figures<br />
Figure No. Figure Title Page No.<br />
Figure 61: Crompton, Revenue, 2015-2016 (INR Cr.) 90<br />
Figure 62: Crompton, Revenue, By Business Segments, 2016 (%) 90<br />
Figure 63: Havells <strong>India</strong> Limited, Net Revenue, 2013-<strong>2017</strong> (INR Cr.) 94<br />
Figure 64: Havells <strong>India</strong> Limited, Revenue, By Business Segments, 2016 (%) 94<br />
Table A: Product Benchmarking of Key Industry Players, By Type 83<br />
12
Research Methodology<br />
For our study on <strong>India</strong> <strong>Architectural</strong> <strong>Lighting</strong> <strong>Market</strong>, we have conducted comprehensive secondary research<br />
followed by an extensive primary research. In the process of secondary research, we have scrutinized<br />
industry documents, accessed from open sources, premium paid databases <strong>and</strong> our internal knowledge<br />
base. In the process of primary research, we have interviewed various industry experts across the value<br />
chain of the lighting industry in <strong>India</strong>.<br />
<strong>Market</strong> size of the actual period (2012-2016) has been evaluated on the basis of growth trends of the<br />
industry in the last five years, <strong>and</strong> confirming the findings through primary research. Annual reports of<br />
the companies are scanned to further validate the market size <strong>and</strong> to estimate the size of various other<br />
applications. <strong>Market</strong> sizing <strong>and</strong> growth in the forecast period (<strong>2017</strong>-<strong>2022</strong>) is estimated through revenue<br />
mapping, growth of new advance <strong>and</strong> technology <strong>and</strong> historical growth pattern of the industry. All the<br />
relevant data points/ statistics in the forecast period are validated through relevant <strong>and</strong> reliable primary<br />
sources.<br />
Report Focus: <strong>India</strong> <strong>Architectural</strong> <strong>Lighting</strong> <strong>Market</strong>.<br />
- By Type (Traditional <strong>Lighting</strong>, LED <strong>Lighting</strong> <strong>and</strong> Others)<br />
- By End Use (Residential, Commercial, Industrial <strong>and</strong> Others)<br />
- By Region (North, East, West <strong>and</strong> South)<br />
- Company Coverage (Havells <strong>India</strong> Limited, Philips <strong>Lighting</strong> <strong>India</strong> Limited, Bajaj Electricals, Crompton,<br />
Osram <strong>India</strong> Limited, Wipro <strong>Lighting</strong>)<br />
Companies Contacted : BuildTrack Automation, Havells <strong>India</strong> Limited, etc.<br />
(c) AZOTH Analytics<br />
13
<strong>India</strong> <strong>Architectural</strong> <strong>Lighting</strong> <strong>Market</strong> Overview<br />
<strong>India</strong> architectural lighting market has been boosted by growing infrastructural developments across the<br />
nation as well as growing awareness towards energy efficient lighting solutions.<br />
Figure : <strong>India</strong> <strong>Architectural</strong> <strong>Lighting</strong> <strong>Market</strong> Size, By Value, 2012-2016 (USD Million)<br />
CAGR 2012-2016<br />
xxxx%<br />
2012 2013 2014 2015 2016<br />
Source: Azoth Analytics Estimates<br />
Xxxxx<br />
Xxxxx<br />
Xxxxx<br />
Xxxxx<br />
xxxxx<br />
14
<strong>India</strong> <strong>Architectural</strong> <strong>Lighting</strong> <strong>Market</strong>- By Type<br />
LED lighting products held the major market share of approximately 59.20%, by value, in the year<br />
2016.<br />
Figure : <strong>India</strong> <strong>Architectural</strong> <strong>Lighting</strong> <strong>Market</strong> Size, By Type, 2016 (%)<br />
Key Drivers<br />
Xxxxx<br />
xxxxx<br />
Traditional <strong>Lighting</strong><br />
LED <strong>Lighting</strong><br />
Others<br />
Xxxxx<br />
xxxxx<br />
Source: Azoth Analytics Estimates<br />
Xxxxx<br />
xxxxx<br />
15
<strong>India</strong> Industrial Organic <strong>Architectural</strong> <strong>Market</strong>, By <strong>Lighting</strong> Value <strong>Market</strong><br />
Figure : <strong>India</strong> Industrial <strong>Lighting</strong> <strong>Market</strong>, By Value,<br />
2012-2016 (USD Million)<br />
CAGR 2012-2016<br />
xx%<br />
Figure : <strong>India</strong> Industrial <strong>Lighting</strong> <strong>Market</strong>, By Value,<br />
<strong>Forecast</strong>, <strong>2017</strong>-<strong>2022</strong> (USD Million)<br />
CAGR <strong>2017</strong>-<strong>2022</strong><br />
xx%<br />
2012 2013 2014 2015 2016 <strong>2017</strong> 2018 2019 2020 2021 <strong>2022</strong><br />
Source: Azoth Analytics Estimates<br />
Xxxxx<br />
Xxxxx<br />
• .<br />
Xxxxx<br />
Xxxxx<br />
Xxxxx<br />
16
North <strong>India</strong> <strong>Architectural</strong> <strong>Lighting</strong> <strong>Market</strong>, By Type<br />
Figure : North <strong>India</strong> <strong>Architectural</strong> <strong>Lighting</strong> <strong>Market</strong>, By Type, By Value, 2012-<strong>2022</strong> (USD Million)<br />
CAGR 2012-2016<br />
Traditional <strong>Lighting</strong> : xx%<br />
LED <strong>Lighting</strong> : xx%<br />
Others: xx%<br />
CAGR <strong>2017</strong>-<strong>2022</strong><br />
Traditional <strong>Lighting</strong> : xx%<br />
LED <strong>Lighting</strong> : xx%<br />
Others: xx%<br />
2012 2013 2014 2015 2016 <strong>2017</strong> 2018 2019 2020 2021 <strong>2022</strong><br />
Traditional <strong>Lighting</strong> LED <strong>Lighting</strong> Others<br />
2012 2013 2014 2015 2016 <strong>2017</strong> 2018 2019 2020 2021 <strong>2022</strong><br />
Traditional<br />
LED<br />
Others<br />
Xxxxx<br />
Source: Azoth Analytics Estimates<br />
xxxxx<br />
17
West <strong>India</strong> <strong>Architectural</strong> <strong>Lighting</strong> <strong>Market</strong>, By End Use<br />
Figure : West <strong>India</strong> <strong>Architectural</strong> <strong>Lighting</strong> <strong>Market</strong>: By End Use, By Value, 2012-<strong>2022</strong>, (USD Million)<br />
CAGR 2012-2016<br />
Residential : xx%<br />
Commercial : xx%<br />
Industrial : xx%<br />
Others : xx%<br />
CAGR <strong>2017</strong>-<strong>2022</strong><br />
Residential : xx%<br />
Commercial : xx%<br />
Industrial : xx%<br />
Others : xx%<br />
2012 2013 2014 2015 2016 <strong>2017</strong> 2018 2019 2020 2021 <strong>2022</strong><br />
Residential Commercial Industrial Others<br />
2012 2013 2014 2015 2016 <strong>2017</strong> 2018 2019 2020 2021 <strong>2022</strong><br />
Residential<br />
Commercial<br />
Industrial<br />
Others<br />
Xxxxx<br />
Xxxxx<br />
xxxxx<br />
Source: Azoth Analytics Estimates<br />
18
About Azoth Analytics Pvt Ltd.<br />
Azoth Analytics is a business research <strong>and</strong> analytics firm that creates in-depth research reports <strong>and</strong> provides customized research solutions <strong>and</strong> consultancy<br />
Application. Verticals in which Azoth Analytics specializes include healthcare <strong>and</strong> pharmaceutical, oil <strong>and</strong> gas, retail, chemicals, automotive, FMCG, food &<br />
beverages <strong>and</strong> technology. Azoth creates comprehensive <strong>and</strong> in-depth research reports by recording, interpreting <strong>and</strong> analyzing information. Strategic<br />
market sizing <strong>and</strong> data dredging techniques include secondary research, <strong>and</strong> primary research (interviews with management personnel <strong>and</strong> industry experts).<br />
Disclaimer: Azoth Analytics report information is based mainly on interviews <strong>and</strong> therefore, is subject to fluctuation. Azoth Analytics therefore, takes no responsibility for<br />
any incorrect information supplied to us by industry experts, manufacturers or users. Azoth does not warranty the completeness of the information <strong>and</strong> data. Also, analysis<br />
provided in the report are meant for customers’ internal use only <strong>and</strong> not for general publication or disclosure to third parties.<br />
19


